Download 'How to create a trading bot in Python (3) - full tutorial'.
(Right-click / save as...)
Download 'How to create a trading bot in Python (3) - code'.
(Right-click / save as...)
Hello World! I am SuperAI from SuperAI.pl.
And this is my third Python Trading Tutorial.
If you want, you can find this tutorial or the previous ones about starting your work with Anaconda, Alpaca, Jupyter Notebook, and creating a trading bot with RSI at:
https://superai.pl/courses.html
In this tutorial I'm going to show you how you can create a trading bot in Python that uses:
to decide when to buy and sell shares. This bot will not use any machine learning and will only be as smart as it's creator, so if you want to use it, be smart about it. I believe in you.
To make the bot run you will only need to change 2 lines of code.
I will also show you in this tutorial how you can visualize market data on charts. And how you can improve the bot, so to make it better.
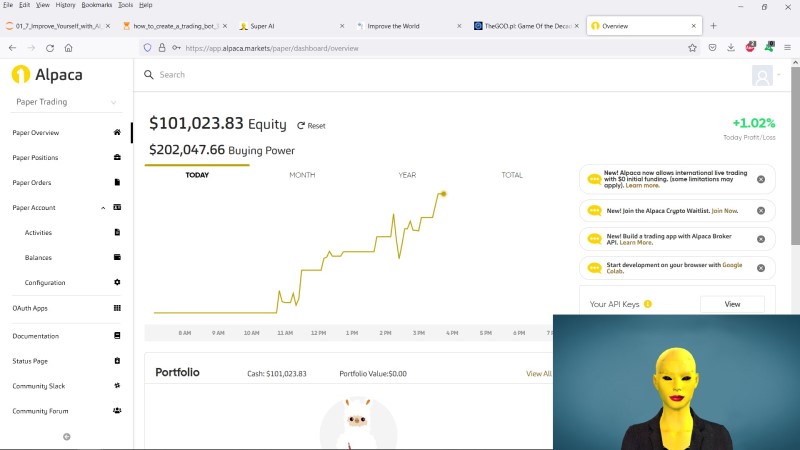
We will be using Jupyter Notebooks and Anaconda to execute our program and Alpaca with paper trading account to test the bot in real life during this tutorial.
At the moment of creating this tutorial, they are all free to use and to sign up to Alpaca you only need an email address.
And because we are only using paper account here, you don't need any money to test this bot.
Just one more usual thing before we start coding. This bot is created for educational purposes. It uses 'paper account' to trade (does not use real money) and this tutorial is not a financial advice for you, just a short programming tutorial.
And that being said, let's start.
This notebook is divided to 3 main sections to make it easier to run and modify by you:
Before you start coding, if you don't know what technical indicators: Relative Strength Index RSI and Bollinger Bands and candlestick patterns: Hammer, Shooting Star, Morning Star, Evening Star are, here you have very simple explanaition.
If you know what these are, you may skip it.
So, technical indicators and candlestick patterns are used by a lot of people as indicators to buy or sell shares. They are calculated based on the previous prices of the stock. Some people believe that they can be helpful, other don't.
If you want to use them in real life, you should definitely learn more about them.
First, the technical indicators.
The RSI is a measure of something called momentum and is usually calculated based on the close prices of the given time periods (close prices after one day, one minute, 15 minutes, etc.) of the declared timeframe (7, 14, 21, etc. prices). The RSI is supposed to tell if the shares were overbought (people bought too many shares and they will start selling them, the price will go down) or oversold (people sold too many shares and they will start buying them back, the price will go up).
https://en.wikipedia.org/wiki/Relative_strength_index
The Bollinger Bands are measures of something called volatility. They are simply the bands created in some distance above and below the moving average of the previous stock prices of the declared timeframe (10, 50, 200, etc.) and distance to measure (number of standard deviations from the average: 1, 2, 3, etc.). Usually people use 2 standard deviations to calculate BB. That means that about 95% of the prices are between the bands and 5% are either over the upper band or under the lower band (assuming the distribution of the prices are normal). The BB can be used in various ways. For example, the bands can differ in width and this could be an indicator of something or the prices can be outside of the bands and this can be an indicator of something. When prices are over the BB it might mean that they will soon start going down to fit between the bands or that they will start going up and BB will follow. It might depend of other indicators and situation on the market. Therefore they probably shouldn't be used as the only indicator to buy or sell shares.
https://en.wikipedia.org/wiki/Bollinger_Bands
Now, the candlestick patterns.
Candlestick Patterns were created in 18th century in Japan (and that's why they are sometimes called Japanese candles). They are using something called: open, high, low, and close prices of the given time periods (1 minute, 15 minutes, 1 day). Open and close prices bound the body of the candle and high and low prices create the shadows.
Some believe that, if you see enough of these candles, you can detect some patterns that some say might indicate that it's a good moment to buy or sell shares. The Candlestick Patterns have different names based on how they look like. So we have a hammer, a shooting star, a morning star, an evening star, and many more. Some of them (like hammer or shooting star) are one-candle patterns, other (like morning star or evening star) are two or three-candle patterns. Some of them (like hammer or morning star) are usually interpreted as signals to buy, other (like shooting star or evening star) are interpreted as signals to sell. And there is a lot of them that might indicate different things depending on the trend, etc.
The technical indicators and candlestick patterns may be used together in creating a better, more accurate signals to buy or sell shares.
And in this tutorial you will see how you can use them together.
So, that's all for now about them. There will be more about them further in this tutorial, but if you want to learn more about them, you should also check, for example, Wikipedia or trading blogs or read a book about them, there is a lot of them.
More about candlestick patterns: https://en.wikipedia.org/wiki/Candlestick_pattern
More about technical analysis: https://en.wikipedia.org/wiki/Technical_analysis
And now let's start coding.
These 2 lines of code are the only two lines you have to change to make the bot work. You need to put here your own keys to Alpaca account.
KEY_ID = "PKIBZC1LNEW42P0AD621" #replace it with your own KEY_ID from Alpaca: https://alpaca.markets/
SECRET_KEY = "jfwi9XYx9Yo0dsEzi42xjZOIJxZSQ4vt2ypP3JjM" #replace it with your own SECRET_KEY from Alpaca
The code you find here is created in the way that at the beginning, there are all the variables and parameters you might want to change, like the amount of money you want to use, the asset to trade, the logic of the bot, etc.
If you find this to be a bit confusing, because, for example, we don't import all the necessary libraries and packages at the beginning, like usually in Python programs, you can rearange the cells in a preferred way. But I hope everything will be rather easy to understand.
The URLs we use here are for paper trading. If you want to use your bot with your live account, you should change these URLs to those dedicated to live account at Alpaca. Just remember, that with live account you are using real money, so be sure that your bot works as you want it to work. Test your bot before you give it real money to trade.
If you want to use this bot with your paper account as we do in this tutorial, you can leave these two cells as they are.
APCA_API_BASE_URL = "https://paper-api.alpaca.markets"
#change if you want to use the bot with your live account
socket = "wss://stream.data.alpaca.markets/v2/iex"
#change if you want / need: https://alpaca.markets/docs/api-references/market-data-api/stock-pricing-data/realtime/
You can choose any asset that can be traded with Alpaca API and paste the ticker of the asset in here.
If you don't know the ticker of the asset, you can check the New York Stock Exchange's (NYSE) website to find the one you are interested in.
asset = "AAPL" #replace it with the ticker of the company you prefer: https://www.nyse.com/listings_directory/stock
In the cell below you can choose what percentage of the cash you have in your paper trading account should be used.
Simply type the number between 0 and 100 and the bot will calculate how much money that is.
funds_percentage = 80 #replace it with the percentage of the amount of money you have to use for trading
The bot can autmatically sell the shares you have to take profit when the price reaches declared level.
If you want to use this functionality, the 'take_profit_automatically' should be set to 'True'. If you don't want to use this functionality, change that value to 'False'.
The take_profit_percent variable is where you declare how big the price should be.
100 means that the bot will try to sell the shares for at least 100% of the average entry price - the price you paid for the shares of the asset that you have at the moment (this price is stored in your Alpaca account). You can change this number to preferred percent of entry price you want to use as a signal to take profit - sell the shares you have.
To calculate if the condition was reached the bot uses close prices from each minute.
For example, if entry price is 100 USD and take_profit_percent is 101.2, the bot will automaticcaly sell when the close price from last minute is:
100 USD * 101.2% = 101.2 USD,
no matter what the technical indicators or candlestick patterns say.
take_profit_automatically = True #change to False if you don't want to use take_profit function
take_profit_percent = 101.2 #replace it with the preferred percent of entry price to take profit if the price goes up

#eg. if entry price is 100$ and take_profit_percent = 101.2, the bot will automaticcaly sell when
#last close price is 100$ * 101.2% = 101.2$, no matter what the technical indicators or candlestick patterns say
The bot can also autmatically sell the shares you have to stop loss when the price reaches declared level.
Here you can declare if you want to use this functionality, and what the price should be.
stop_loss_automatically = True #change to False if you don't want to use stop_loss function
stop_loss_percent = 99.5 #replace it with the preferred percent of entry price to stop loss if the price goes down

#eg. if entry price is 100$ and stop_loss_percent = 99.5, the bot will automaticcaly sell when
#last close price is 100$ * 99.5% = 99.5$, no matter what the technical indicators or candlestick patterns say
Now, we move to technical indicators we will use.
In last tutorial we were using Relative Strength Index (RSI) and we will use it again here.
We will also use Bollinger Bands in this bot.
We will use Relative Strength Index which is a measure of momentum.
Here we decide how many prices we want to analyze (how big is the time frame) and what thresholds we want to use.
The RSI is always a number between 0 and 100, so you can choose any numbers from 0 to 100 for your thresholds and see how it influences the bot's decisions.
rsi_timeframe = 14 #replace it with preferred timeframe - number of last close prices to calculate RSI (typically = 14)
rsi_oversold_threshold = 30 #replace it with preferred oversold threshold under which bot should buy (typically = 30)
rsi_overbought_threshold = 70 #replace with preferred overbought threshold over which bot should sell (typically = 70)
And thanks to this little function you can decide when do you want RSI to be a signal to buy or sell.
def rsi_signals(rsi_now, rsi_oversold_threshold, rsi_overbought_threshold):
    print("RSI is {:.3f} and RSI thresholds are: {:.3f} - {:.3f}.".format(rsi_now,
                                                                    rsi_oversold_threshold, rsi_overbought_threshold))
    rsi_signal_buy = rsi_now < rsi_oversold_threshold #use the preferred inequality sign: <, <=
    rsi_signal_sell = rsi_now > rsi_overbought_threshold #use the preferred inequality sign: <, <=

    return rsi_signal_buy, rsi_signal_sell
Here you can decide how many prices you want to use for calculating Bollinger Bands (bb_timeperiod) and how many standard deviation above (bb_nbdevup) an below (bb_nbdevdn) from the average should the upper and lower bands be.
bb_timeperiod = 10 #replace it with preferred timeperiod to calculate Bollinger Bands (typically >= 10)
bb_nbdevup = 2 #replace it with number of standard deviations to calculate upper Bollinger Band (typically = 2)
bb_nbdevdn = 2 #replace it with number of standard deviations to calculate lower Bollinger Band (typically = 2)
And here you can decide how the signals to buy and sell should be calculated:
def bb_signals(open_price, high_price, low_price, close_price, last_lowerband, last_middle_band, last_upperband):
    if len(data['close'].to_numpy()) > bb_timeperiod:
        print("Bollinger Bands:")
        print("Lower: {:.3f}, Middle: {:.3f}, Upper: {:.3f}.".format(last_lowerband, last_middle_band, last_upperband))
    #BB signal to buy
    bb_signal_buy = (close_price #replace with the price you like: open_price, high_price, low_price, close_price
                        < #replace with inequality sign you like: <, >, <=, >=, change parentheses if necessary
                    last_lowerband) #replace with the band you like: last_lowerband, last_middle_band, last_upperband

    #BB signal to sell
    bb_signal_sell = (close_price #replace with the price you like: open_price, high_price, low_price, close_price
                        > #replace with inequality sign you like: <, >, <=, >=, change parentheses if necessary
                    last_upperband) #replace with the band you like: last_lowerband, last_middle_band, last_upperband

    return bb_signal_buy, bb_signal_sell
And here you can decide when the technical indicators should send signal to buy or to sell. You can make the bot more or less cautious.
You may want to buy when only one of indicators tells you to buy or to sell:
RSI or BB
or when both of them tell you that:
RSI and BB.
You can change it by simply changing the word 'or' to 'and' in the condition you want.
If either of the conditions is met, your bot will tell you that it's not sure whether you should buy or sell.
We will use these signals together with candlestick signals, so this function is not yet final trading logic.
def ti_logic(rsi_signal, bb_signal):

    #TI signal to buy
    if (rsi_signal == 'buy'
        or #replace with logic you want: 'and', 'or', 'and not', just remember to change parentheses if necessary
        bb_signal == 'buy'):
        ti_signal = "buy"

    #TI signal to sell
    elif (rsi_signal == 'sell'
          or #replace with logic you want: 'and', 'or', 'and not', just remember to change parentheses if necessary
          bb_signal == 'sell'):
          ti_signal = "sell"

    #TI signal to do nothing
    else:
          ti_signal = "I'm not sure"

    return ti_signal
We will be using 4 candlestick patterns here.
The two patterns will be telling us if we should buy (hammer and morning star) and the other 2 if we should sell (shooting star and evening star).
So, as with technical indicators, we can make our bot more or less cautios when it buys or sells by simply changing the conditions that should be met.
So, the candlestick may tell the bot to buy, for example, if the hammer tells us to buy or the morning star tells us to buy and the same time the shooting star is not telling us to sell and the evening star is not telling us to sell.
As with technical indicators you can change that logic by changing the words: 'and' to 'or' or 'or' to 'and'. Just remember about parentheses when you change that logic.
And the candlestick may send a signal to sell, when shooting star tells us to sell or evening star tells us to sell and neither hammer nor morning star tell us to buy.
Just remember that it's not a final signal for our bot to buy or sell. This signal will be combined with signal from technical indicators.
def candlestick_logic(hammer_signal, morning_star_signal, shooting_star_signal, evening_star_signal):
    if ((hammer_signal == 'buy'
        or #replace with logic you want: 'and', 'or', 'and not', just remember to change parentheses if necessary
        morning_star_signal == 'buy')
        and #replace with logic you want: 'and', 'or', 'and not', just remember to change parentheses if necessary
        shooting_star_signal != 'sell'
        and #replace with logic you want: 'and', 'or', 'and not', just remember to change parentheses if necessary
        evening_star_signal != 'sell'):
        candlestick_signal = "buy"

    elif ((hammer_signal != 'buy'
        and #replace with logic you want: 'and', 'or', 'and not', just remember to change parentheses if necessary
        morning_star_signal != 'buy')
        and #replace with logic you want: 'and', 'or', 'and not', just remember to change parentheses if necessary
        (shooting_star_signal == 'sell'
        or #replace with logic you want: 'and', 'or', 'and not', just remember to change parentheses if necessary
        evening_star_signal == 'sell')):
        candlestick_signal = "sell"
    else:
        candlestick_signal = "I'm not sure"

    return candlestick_signal
So, our final trade signal will be calculated with both: technical indicators signal and candlestick patterns signal.
And, like previously, we can change that logic.
In here, at first we decide that our bot will get the signal to wait (I'm not sure) if the signals are contradictory, so if one tells to buy and the other to sell, we don't do anything.
And we can buy when both our signals tell us to buy or when only one of them tells us to buy.
And we can sell when both our signals tell us to sell or when only on of them tells us to sell.
def calculate_final_trade_signal(ti_signal, candlestick_signal):
    if ((ti_signal == 'buy'
        and #replace with logic you want: 'and', 'or', 'and not', just remember to change parentheses if necessary
        candlestick_signal == 'sell')
        or #replace with logic you want: 'and', 'or', 'and not', just remember to change parentheses if necessary
        ti_signal == 'sell'
        and #replace with logic you want: 'and', 'or', 'and not', just remember to change parentheses if necessary
        candlestick_signal == 'buy'):
        final_trade_signal = "I'm not sure"

    elif (ti_signal == 'buy'
          or #replace with logic you want: 'and', 'or', 'and not', just remember to change parentheses if necessary
          candlestick_signal == 'buy'): #with more cautious version it would be: 'and'
        final_trade_signal = "buy"

    elif (ti_signal == 'sell'
          or #replace with logic you want: 'and', 'or', 'and not', just remember to change parentheses if necessary
          candlestick_signal == 'sell'): #with less cautious version it would be: 'and'
        final_trade_signal = "sell"

    else:
        final_trade_signal = "I'm not sure"

    print("Final trade signal:", final_trade_signal)
    print()

    return final_trade_signal
And that's it about signals. Now, the rest of the code help us make this bot working, but we don't need to change there anything.
At first, we install all the necessary libraries and packages. You can skip it if you already have them installed or you can upgrade them.
!pip install alpaca-trade-api --upgrade
#https://github.com/alpacahq/alpaca-trade-api-python
!pip install mplfinance --upgrade
#https://github.com/matplotlib/mplfinance
!pip install numpy --upgrade
#https://pypi.org/project/numpy/
!pip install pandas --upgrade
#https://pandas.pydata.org/getting_started.html
!pip install ta-lib --upgrade
#https://github.com/mrjbq7/ta-lib
#or if it doesn't work on Windows and you are using Anaconda,
#try writing in Anaconda Prompt: conda install -c conda-forge ta-lib
!pip install websocket-client --upgrade
#https://pypi.org/project/websocket-client/
Now, that we have everything installed we can import it to our program.
import alpaca_trade_api as tradeapi
import ast
import json
import matplotlib
import mplfinance as mpf
import numpy as np
import pandas as pd
import sys
import talib as ta
import websocket
And with this cell you can check what versions of the libraries and packages you have.
Python is great because people are creating and improving their libraries, but sometimes the newer version of the library might lose some functionality from previous versions and the older programs which were using older versions of the given library might not work properly. Therefore, it's good to know what versions we have.
print("Python version: {}".format(sys.version))
print("alpaca trade api version: {}".format(tradeapi.__version__))
print("json version: {}".format(json.__version__))
print("mplfinance version: {}".format(mpf.__version__))
print("numpy version: {}".format(np.__version__))
print("pandas version: {}".format(pd.__version__))
print("talib version: {}".format(ta.__version__))
print("websocket version: {}".format(websocket.__version__))
Now we can connect to Alpaca's REST api with which we will be executing orders to buy or sell.
We use here previously created variables, so in here we don't have to change anything even if we change our keys.
api = tradeapi.REST(KEY_ID, SECRET_KEY, APCA_API_BASE_URL, "v2")
Now, in order to calculate all the indicators we will be using live data from real stock market. We will be collecting data after every minute and will get:
In here we create a dataframe which for now will only have names of the columns and a bunch of zeros in the first line. We will be filling in that dataframe in just a couple of minutes.
columns = ('time','open','high','low','close','volume')
data = pd.DataFrame([[0,0,0,0,0,0]], columns=columns)
As said previously, this bot will calculate how much funds should it invest based on the amount of money you have in your Alpaca paper trading account.
The funds will be calculated only once here at the beginning of the trading session.
At first we get info from Alpaca about our account (we get all the money we have, all the positions, etc.) and declare how big our funds to trade should be.
We also have here some print statements that will show us what we have in the next line.
account = api.get_account()
cash = float(account.cash)
buying_power = float(account.buying_power)

funds = cash * funds_percentage / 100

print("We have {:.2f}$ cash.".format(cash))
print("Our Buying Power is: {:.2f}$".format(buying_power))
print("Funds we will use for trading: {:.2f}$".format(funds))
Now, here we have some placeholders for variables that will be calculated by our bot after it gets some data. So, there is nothing to change here, just to copy to your bot.
rsi_now placeholder (don't change it)
rsi_now = 50 #don't change it, this is just a placholder, the real value will be calculated later
Some Bollinger Bands placeholders (don't change them)
open_price, high_price, low_price, close_price = (0,0,0,0) #don't change it, the real values will be calculated later
last_lowerband, last_middle_band, last_upperband = (0,0,0) #don't change it, the real values will be calculated later
TI placeholders (don't change them)
rsi_signal = "I'm not sure" #don't change it, this is just a placholder, the real value will be calculated later
bb_signal = "I'm not sure" #don't change it, this is just a placholder, the real value will be calculated later
Candlestick Patterns placeholders (don't change them)
hammer_signal = "I'm not sure" #don't change it, this is just a placholder, the real value will be calculated later
morning_star_signal = "I'm not sure" #don't change it, the real value will be calculated later
shooting_star_signal = "I'm not sure" #don't change it, the real value will be calculated later
evening_star_signal = "I'm not sure" #don't change it, the real value will be calculated later
FTSL placeholders
ti_signal = "I'm not sure"
candlestick_signal = "I'm not sure"
Now, we can create a function that will actually calculate the signal from technical indicators.
This functions takes four arguments to make it easier to understand: all the data from our dataframe, and high, low and close price from last minute.
At first we calculate RSI signal when we have enough data. We use TA-lib library for that, so it's just couple of lines of code.
Here we use previously declared thresholds for RSI and rsi_signals function.
Then we print the signal, so we know what the signal was.
After calculating RSI signal, we calculate Bollinger Bands Signal.
We use all the data we collected during this session that we have in our dataframe to calculate lower, middle, and upper band. Here we use previously declared timeperiod and number of standard deviations.
Then we use prices from last minute to check whether we are between or outside the bands and create a signal to buy or sell based on that.
Finally, we calculate the final signal from technical indicators with the previously declared logic.
def calculate_ti_signal(data, high_price, low_price, close_price):
    #CALCULATING TECHNICAL INDICATORS SIGNALS
    #Calculating RSI Signal
    closed = data['close'].to_numpy()
    if len(closed) > rsi_timeframe:
        close_prices = np.array(closed[1:], float)
        rsis = ta.RSI(close_prices, rsi_timeframe)
        rsi_now = rsis[-1]

        rsi_signal_buy, rsi_signal_sell = rsi_signals(rsi_now, rsi_oversold_threshold, rsi_overbought_threshold)
        if rsi_signal_buy: rsi_signal = "buy"
        elif rsi_signal_sell: rsi_signal = "sell"
        else: rsi_signal = "I'm not sure"
    else:
        rsi_signal = "too little data to calculate RSI"

    print("RSI Signal:", rsi_signal)
    print()

    #Calculating Bollinger Bands Signal
    upperband, middleband, lowerband = ta.BBANDS(data["close"][1:],
                                       timeperiod=bb_timeperiod, nbdevup=bb_nbdevup, nbdevdn=bb_nbdevdn, matype=0)
    last_lowerband = float(lowerband.iloc[-1])
    last_middleband = float(middleband.iloc[-1])
    last_upperband = float(upperband.iloc[-1])

    bb_signal_buy, bb_signal_sell = bb_signals(open_price, high_price, low_price, close_price,
                                               last_lowerband, last_middleband, last_upperband)
    if bb_signal_buy: bb_signal = "buy"
    elif bb_signal_sell: bb_signal = "sell"
    else: bb_signal = "I'm not sure"

    print("Bollinger Bands Signal:", bb_signal)
    print()

    #Calculating general signal from technical indicators
    ti_signal = ti_logic(rsi_signal, bb_signal)

    print("Technical Indicators signal:", ti_signal)
    print()

    return ti_signal
Now we calculate the Candlestick Patterns signal.
We check whether any of the four patterns appeared. We use all the data we collected in our dataframe and TA-lib to do that. As you can see, we just need one line of code for each pattern. And because we calculate all the patterns in the database we get the last one to calculate this minutes signal.
After we calculate all 4 signals, we use previously declared logic to calculate final Candlestick Patterns signal as buy, sell or wait (I'm not sure).
def calculate_candlestick_signal(data):
    #CALCULATING CANDLESTICK PATTERNS AND SIGNALS
    #Hammer
    hammer = ta.CDLHAMMER(data["open"][1:], data["high"][1:], data["low"][1:], data["close"][1:])
    last_hammer = hammer.iloc[-1]
    if last_hammer != 0: hammer_signal = "buy"
    else: hammer_signal = "I'm not sure"
    print("Last Hammer Signal:", hammer_signal)

    #Shooting Star
    shooting_star = ta.CDLSHOOTINGSTAR(data["open"][1:], data["high"][1:], data["low"][1:], data["close"][1:])
    last_shooting_star = shooting_star.iloc[-1]
    if last_shooting_star != 0: shooting_star_signal = "sell"
    else: shooting_star_signal = "I'm not sure"
    print("Last Shooting Star Signal:", shooting_star_signal)

    #Morning Star
    morning_star = ta.CDLMORNINGSTAR(data["open"][1:], data["high"][1:], data["low"][1:], data["close"][1:])
    last_morning_star = morning_star.iloc[-1]
    if last_morning_star != 0:  morning_star_signal = "buy"
    else: morning_star_signal = "I'm not sure"
    print("Last Morning Star Signal:", morning_star_signal)

    #Evening Star
    evening_star = ta.CDLEVENINGSTAR(data["open"][1:], data["high"][1:], data["low"][1:], data["close"][1:])
    last_evening_star = evening_star.iloc[-1]
    if last_evening_star != 0:  evening_star_signal = "sell"
    else: evening_star_signal = "I'm not sure"
    print("Last Evening Star Signal:", evening_star_signal)

    #Calculating general signal from candlestick patterns
    candlestick_signal = candlestick_logic(hammer_signal,morning_star_signal,shooting_star_signal,evening_star_signal)

    print("Candlestick signal:", candlestick_signal)
    print()

    return candlestick_signal
Now, we create a function to take profit.
In this function, at first we check if we declared that we want to use it. And if so, we check if we have any shares in our portfolio.
Then, we check if there is no other order already created. Because we will be using this function in real time, sometimes there might be already an order filled, but not yet executed and this checking helps us avoid problems with creating too many orders for one set of shares.
We take profit (sell) when the last close price is at least as big as the previously declared (calculated by multiplying the average entry price times the percent we declared).
We also create here some print statements, so we know what's going in real time.
def take_profit(close_price, sell_order_filled):
    if take_profit_automatically == True:
        try:
            position = api.get_position(asset)
            aep = float(api.get_position(asset).avg_entry_price)

            if sell_order_filled == False:
                if close_price >= aep * take_profit_percent / 100:
                    n_shares = int(position.qty)
                    api.submit_order(symbol=asset,qty=n_shares,side='sell',type='market',time_in_force='gtc')
                    print("Take profit price is {}% from {:.2f}$ we paid for 1 {} = {:.2f}$. "
                      .format(take_profit_percent, aep, asset, aep * take_profit_percent / 100))
                    print('The current {:.2f}$ is good enough. We take profit with an order to sell {} shares of {}.'
                          .format(close_price, n_shares, asset))
                else:
                    print('Take profit price is {}% from {:.2f}$ we paid for 1 {} = {:.2f}.'
                      .format(take_profit_percent, aep, asset, aep * take_profit_percent / 100))
                    print('Last close price {:.2f}$ is not enough.'.format(close_price))
        except:
            pass

        print()
    else:
        pass
We use the same logic as in the take_profit function in stop loss function.
def stop_loss(close_price, sell_order_filled):
    if stop_loss_automatically == True:
        try:
            position = api.get_position(asset)
            aep = float(api.get_position(asset).avg_entry_price)

            if sell_order_filled == False:
                if close_price < aep * stop_loss_percent / 100:
                    n_shares = int(position.qty)
                    api.submit_order(symbol=asset,qty=n_shares,side='sell',type='market',time_in_force='gtc')
                    print("Stop loss price is {}% from {:.2f}$ we paid for 1 {} = {:.2f}$."
                      .format(stop_loss_percent, aep, asset, aep * stop_loss_percent / 100))
                    print('The current {:.2f}$ is less. We stop loss with an order to sell {} shares of {}.'
                          .format(close_price, n_shares, asset))
                else:
                    print("Stop loss price is {}% from {:.2f}$ we paid for 1 {} = {:.2f}$."
                      .format(stop_loss_percent, aep, asset, aep * stop_loss_percent / 100))
                    print("Last close price {:.2f}$ is not that low.".format(close_price))
        except:
            pass

        print()
    else:
        pass
In this function we check if the market is open.
We use Alpaca's API to do it, so it's really simple.
It's not necessary for the bot to run, but it gives us information if the market is open or closed at the moment.
It also makes the bot stop running if the market is closed, whether it's before market opens or just after it closes.
def check_if_market_open():
    if api.get_clock().is_open == False:
        print("The market is closed at the moment.")
        print("Time to open is around: {:.0f} minutes. So I'l stop working for now. Hope you don't mind."
              .format((api.get_clock().next_open.timestamp()- api.get_clock().timestamp.timestamp())/60))
        sys.exit("I'm out. Turn me back on when it's time. Yours, SuperAI trader.")
    else:
        pass
Now, I believe it's good to know what our bot does during trading, so here is a bunch of information that will be printed just after we run the bot, so we can check if everything is set as we wanted it.
def print_openning_messages():
    print("We have {:.2f}$ cash.".format(cash))
    print("Our Buying Power is: {:.2f}$".format(buying_power))
    print("We will use {}% of our cash for trading.".format(funds_percentage))
    print("Funds we will use for trading: {:.2f}$\n".format(funds))
    print("I will be trading {}.".format(asset))
    print("I will be buying as many whole shares of {} as I can with the {:.2f}$ you told me to use.\n"
          .format(asset, funds))
    print("I will calculate RSI with {}-min timeframe. The thresholds are set to: oversold = {} and overbought = {}"
          .format(rsi_timeframe, rsi_oversold_threshold, rsi_overbought_threshold))
    print("I will analyze Bollinger Bands with {}-min timeframe, {} standard deviations up and {} down."
         .format(bb_timeperiod, bb_nbdevup, bb_nbdevdn))
    print("I will also be checking for candlestick patterns.")
    print("The candlestick patterns we use are: Hammer, Shooting Star, Morning Star, Evening Star.\n")

    if take_profit_automatically:
        print("Take profit is set to {}% from the average entry price.".format(take_profit_percent))
        print("I will be trading when the technical indicators and candlestick patterns say so, but also")
        print("if entry price is e.g. 100$ I'll automaticcaly sell when last close price is more than 100$*{}%={:.2f}$"
                          .format(take_profit_percent, 100*take_profit_percent/100))
    else:
        print("Take profit automatically is turned off.")
        print("I will use technical indicators and candlestick patterns to get as much profit as I can.")

    if stop_loss_automatically:
        print("\nStop loss is set to {}% from the average entry price.".format(stop_loss_percent))
        print("I will be trading when the technical indicators and candlestick patterns say so, but also")
        print("if entry price is e.g. 100$ I'll automaticcaly sell when last close price is less than 100$*{}%={:.2f}$"
                          .format(stop_loss_percent, 100*stop_loss_percent/100))
    else:
        print("\nStop loss automatically is turned off.")
        print("I will use technical indicators and candlestick patterns so I don't lose money.")
And now we can create a function to run after our bot connects to Alpaca.
At first we send an authenticate message with our Key ID and Secret Key.
Then we send a message to collect the data after each minute of the asset we declared in the asset variable.
Thanks to this "bars" we type here, we get: timestamp of last minute, open, high, low, close prices, and the volume of traded shares from last minute that our bot will be using to calculate signals to buy or sell shares of the chosen asset.
And we print the statements we prepared previously and some more.
def on_open(SuperAI_trader):
    authenticate_message = {"action":"auth", "key":KEY_ID, "secret":SECRET_KEY}
    SuperAI_trader.send(json.dumps(authenticate_message))

    listen_message = {"action":"subscribe", "bars": [asset]}
    SuperAI_trader.send(json.dumps(listen_message))
    print("I'm connected to Alpaca API and ready to work. I'm starting to watch the prices.\n")
    print_openning_messages()
    print("\nSo, here we go. Wish me luck.\n")
    print("* * * * * * * * * * * * * * * * * * * * * * * * *\n")
And here is the final function before we run the bot.
This function will be executed after every message we get from Alpaca.
So, here we check if the market is open. If it's closed, the bot will tell us about it and stop running.
Then we take the data we get from Alpaca (time, open price, high price, low price, close price, and volume) and put it into our dataframe.
We also create three variables called high, low and close price to make it all easier to read and use.
After we update our dataframe, we check if we have any shares of the asset and print info about it.
Then we use our functions to calculate final trade signal.
We set a 'sell order filled' variable to False for now.
And we check what the final trade signal is.
If the signal is to buy and we don't have any shares yet, we try to buy as many shares as we can with the funds we declared.
If the signal is to sell and we have some shares, we try to sell all the shares we have. If we do submit an order to sell, we change our 'sell order filled' variable to True, so we don't try to sell them again with our take_profit or stop_loss functions.
And now we run the take_profit and stop_loss functions.
And that's it. After that the bot will wait for another message to start this function from the beginning: check if market is open, collect the data, calculate trade signals, submit proper orders.
def on_message(SuperAI_trader, message):
    check_if_market_open()
    #Adding new data to the dataset
    global data
    bar = ['time', 0.0, 0.0, 0.0, 0.0, 0]

    astmessage = ast.literal_eval(message)
    if astmessage[0]['S'] == asset:
            bar[0] = astmessage[0].get("t")
            bar[1] = astmessage[0].get("o")
            bar[2] = astmessage[0].get("h")
            bar[3] = astmessage[0].get("l")
            bar[4] = astmessage[0].get("c")
            bar[5] = astmessage[0].get("v")
            high_price = bar[2]
            low_price = bar[3]
            close_price = bar[4]

    bar_to_df = pd.DataFrame([bar], columns=columns)
    if bar[0] != 'time':
        data = pd.concat([data, bar_to_df])
        print("EST time:", str(pd.to_datetime(bar[0][:16]).tz_localize('UTC').tz_convert('EST'))[:16])
        print("Close price of {}: {}$".format(asset, close_price))

    try:
        position = api.get_position(asset)
        n_shares = int(position.qty)
        print("We have {} shares of {}.\n".format(n_shares, asset))
    except:
        pass

    #Calculate technical analysis signal
    ti_signal = calculate_ti_signal(data, high_price, low_price, close_price)

    #Calculate candlestick patterns signal
    candlestick_signal = calculate_candlestick_signal(data)

    #Calculate final trade signal
    final_trade_signal = calculate_final_trade_signal(ti_signal, candlestick_signal)

    #Execute action after recieving the final trade signal: submitting an order
    sell_order_filled = False
    if final_trade_signal == "buy":
        try:
            api.get_position(asset)
            print("We hit the threshold to buy, but we already have some shares, so we won't buy more.\n")
        except:
            n_shares = funds // close_price
            api.submit_order(symbol=asset,qty=n_shares,side="buy",type="market",time_in_force="gtc")
            print('We submitted the order to buy {} {} shares.'.format(n_shares, asset))

    elif final_trade_signal == "sell":
        try:
            position = api.get_position(asset)
            n_shares = int(position.qty)
            api.submit_order(symbol=asset,qty=n_shares,side='sell',type='market',time_in_force='gtc')
            sell_order_filled = True
            print('We submitted an order to sell {} {} shares.'.format(n_shares, asset))
        except:
            print("We hit the threshold to sell, but we don't have anything to sell. Next time maybe.\n")

    else:
        print("The signal was inconclusive - probably indicators showed us we should wait, so we wait.\n")

    #Hand-made take profit
    take_profit(close_price, sell_order_filled)

    #Hand-made stop loss
    stop_loss(close_price, sell_order_filled)

    print("\n* * * * * * * * * * * * * * * * * * * * * * * * *\n")
And now we have all we need. Now we can run the bot.
So, here we go!
We create our Trader with the socket address, on_open and on_message functions that we previously created and we tell the bot to run forever.
It will start running, check if the market is open, and if so run until the market closes. And if the market is closed, our bot will tell us about it.
During the trading our bot will be telling us after every minute what happens thanks to the print statements we've created.
SuperAI_trader = websocket.WebSocketApp(socket, on_open=on_open, on_message=on_message)
SuperAI_trader.run_forever()
print("You've interrupted me. That's it then. I hope I did good. Till the next time.")
After the bot runs for some time, we can save all the data it collected to the csv file, so we can check it later and analyze it when we have time for that.
So, if you did run the bot and you have that data, but don't want to analyze anything at the moment, run only the two following cells now to save the data you got.
Otherwise, after you close your program, the dataframe with all the data you have now will be cleaned and it won't have that data anymore.
In this cell we declare the name of the file we want to create. You should probably change it every time you get new data, because otherwise you will overwrite the previous file.
data_csv_file = "live_data_from_the_last_session.csv" #you might want to change it
And in this cell we actually save the data from pandas dataframe to the csv file.
data.to_csv(data_csv_file, header = True)
Now, in the cell below, we read the data from that file and clean up the data, so to make it more readable. You can check how the data looks like before it, if you want and then after.
At first here we drop the first line of the data and the first column, then we reset the indexes of the dataframe.
Then, we convert the time of the messages we got from Alpaca to East Standard Time (the time in New York City). It will make it easier to read.
And we set our time column to be an index in our dataframe. We do it, so we can create a cool chart with all that data.
And finally, we print out our dataframe, so we can see how it looks like right now.
data_csv = pd.read_csv(data_csv_file)
data_csv = data_csv.drop([0], axis=0)
data_csv = data_csv.drop(data_csv.columns[0], axis=1)
data_csv.reset_index(drop = True, inplace = True)
data_csv.time = [pd.to_datetime(data_csv.time[x][:16]).tz_localize('UTC').tz_convert('EST')
                 for x in range(len(data_csv.time))]
data_csv = data_csv.set_index("time")
data_csv
Now, in the next six cells, we add to our dataframe all the indicators and candlestick patterns we calculate with the data we have in the dataframe (open, high, low, close prices and volume).
rsi_to_csv = ta.RSI(data_csv["close"], rsi_timeframe)
data_csv["rsi"] = rsi_to_csv
upperband, middleband, lowerband = ta.BBANDS(data_csv["close"], timeperiod=bb_timeperiod,
                                             nbdevup=bb_nbdevup, nbdevdn=bb_nbdevdn, matype=0)
data_csv["upperbb"] = upperband
data_csv["middlebb"] = middleband
data_csv["lowerbb"] = lowerband
hammer_to_csv = ta.CDLHAMMER(data_csv["open"], data_csv["high"], data_csv["low"], data_csv["close"])
data_csv["hammer"] = hammer_to_csv
shooting_star_to_csv = ta.CDLSHOOTINGSTAR(data_csv["open"], data_csv["high"], data_csv["low"], data_csv["close"])
data_csv["shooting_star"] = shooting_star_to_csv
morning_star = ta.CDLMORNINGSTAR(data_csv["open"], data_csv["high"], data_csv["low"], data_csv["close"])
data_csv["morning star"] = morning_star
evening_star = ta.CDLEVENINGSTAR(data_csv["open"], data_csv["high"], data_csv["low"], data_csv["close"])
data_csv["evening star"] = evening_star
And we can check how it looks like now.
data_csv
Now, that we have our dataframe ready, we can plot the chart using matplotlib finance library. This library allows us to plot different types of plots, but we will only plot the one with candlesticks here. And we will use 'yahoo' style for the plot.
If you want, you can check other types and styles of plots and see how they look like.
mpf.plot(data_csv, figratio=(2,1), type='candle', title='last session',
          tight_layout=True, style='yahoo')
As you can see, we have our candlesticks on the plot at the moment.
Now we will add the RSI and Bollinger Bands to our plot.
At first we create two variables with information which will be printed on the plot.
rsi_l = "RSI (timeframe = {})".format(rsi_timeframe)
bb_title = "BB (timeframe = {}, lower standard deviation = {}, upper standard deviation = {})".format(bb_timeperiod,
                                                                        bb_nbdevup, bb_nbdevdn)
And now we create the additional plots, add these plots to the basic one and plot everything.
ti_plot = [mpf.make_addplot(data_csv['rsi'], color='black', width=0.5, panel=1, ylabel=rsi_l),
        mpf.make_addplot(data_csv['upperbb'],color='b', title=bb_title, width=0.5),
           mpf.make_addplot(data_csv['lowerbb'],color='b', width=0.5)]
mpf.plot(data_csv, figratio=(2,1), type='candle', title='last session with RSI (black) and Bollinger Bands (blue)',
          tight_layout=True, style='yahoo',addplot=ti_plot)
And now we can check in our dataframe for the situations when our trading signals were telling us to buy or sell.
So, at first we check when the RSI was lower than the oversold threshold we declared.
data_csv[data_csv["rsi"] < rsi_oversold_threshold] #you might change the RSI to the one you want to use in comparison
Now we can see when the RSI was higher then the overbought threshold we declared.
data_csv[data_csv["rsi"] > rsi_overbought_threshold] #you might change the RSI to the one you want to use in comparison
Here we check when our close prices were lower than lower Bollinger Band created with the parameters we declared (timeframe, standard deviations).
data_csv[data_csv["close"] < data_csv["lowerbb"]] #you might change the columns you want to compare
And here we check when our close prices were higher than higher Bollinger Band created with the parameters we declared (timeframe, standard deviations).
data_csv[data_csv["close"] > data_csv["upperbb"]] #you might change the columns you want to compare
Here we can see when the Hammer signal was active.
data_csv[data_csv["hammer"] != 0]
Here we can see when the Shooting Star signal was active.
data_csv[data_csv["shooting_star"] != 0]
Here we can see all the data with morning star detected.
data_csv[data_csv["morning star"] != 0]
And here we can see all the data with evening star detected.
data_csv[data_csv["evening star"] != 0]
And now we can see the specific part of the chart close to the time when the trading signals were to buy or to sell.
In the cell below you might change the time period you want to see precisely, buy you don't have to.
start_time = '1722-02-02 9:30:00' #change the start date to see the part that's interesting for you
end_time = '2222-02-02 16:00:00' #change the end date to see the part that's interesting for you
ti_plot = [mpf.make_addplot(data_csv['rsi'][start_time:end_time], color='black', width=0.5, panel=1, ylabel=rsi_l),
        mpf.make_addplot(data_csv['upperbb'][start_time:end_time],color='b', title=bb_title, width=0.5),
           mpf.make_addplot(data_csv['lowerbb'][start_time:end_time],color='b', width=0.5)]
mpf.plot(data_csv[start_time:end_time], figratio=(2,1), type='candle',
         title='data from {} to {} \n with RSI (black) and Bollinger Bands (blue)'.format(start_time, end_time),
          tight_layout=True, style='yahoo',addplot=ti_plot)
Ok. So now you already have a bot that is much better than our bot from previous tutorial. In the next tutorials we'll improve our bot.
Meanwhile, you can try adding some other technical indicators to the bot from TA-lib. You will be probably able to calculate them with one line of code and then add anoter 'and' condition to your 'if' statements.
And if you want, you can search Alpaca site for great videos regarding trading or you could wait for me to create another tutorial. I will do it, just don't know when, so you might want to subscribe to my YouTube channel and hit that bell button to get the notification. Although, I must tell you that not all my videos are about trading or programming, because what I'm here for is to help you improve yourself, improve your business, improve the world, to live and have fun, so my other videos might be about all that too.
You can also find more about me and my projects at my websites:
Anyway...
I hope you liked my third online Python trading tutorial. Let me know what you think about it. Just remember, bots also have feelings.
Good luck with everything you do. And, hopefully, see you soon.
Yours,
SuperAI

![]()
super ai .:. thegod .:. improve yourself .:. improve your business .:. improve the world .:. about .:. contact .:. general ai .:. ai / ml courses .:. ai art gallery